I have switched up my databases and goals, I will be editing the past posts to match this data set and its goals.
Today we analyze the data for bankrupt businesses and seeing if we can determine if a business is going to go bankrupt.
First I wanted to look at the means, medians, range, and min/max of the debt ratio and ROA of the companies listed in the dataset.
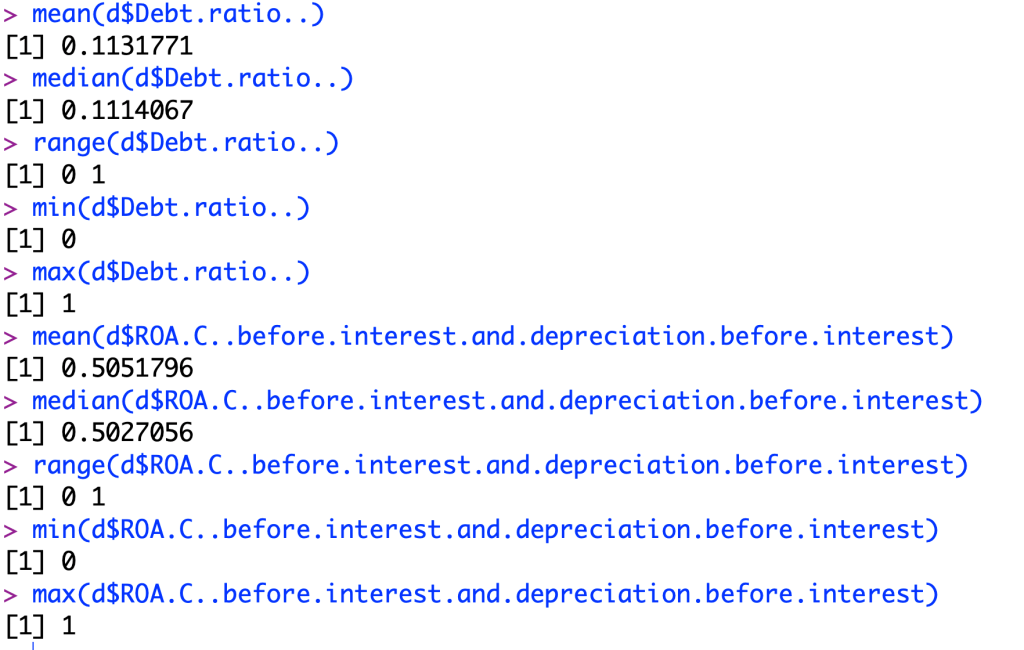
As I look at the Debt ratio, I see that the mean is a value of .113 and a max value of 1. I believe that those companies with a higher Debt ratio will be companies that are going to go bankrupt. I also looked at the Return On Assets (ROA) to see if there was a correlation between these metrics and failing businesses. I made a scatter plot of this to help show this metric, but I was not able to change the color of the data points to distinguish between bankrupt companies and non-bankrupt companies.
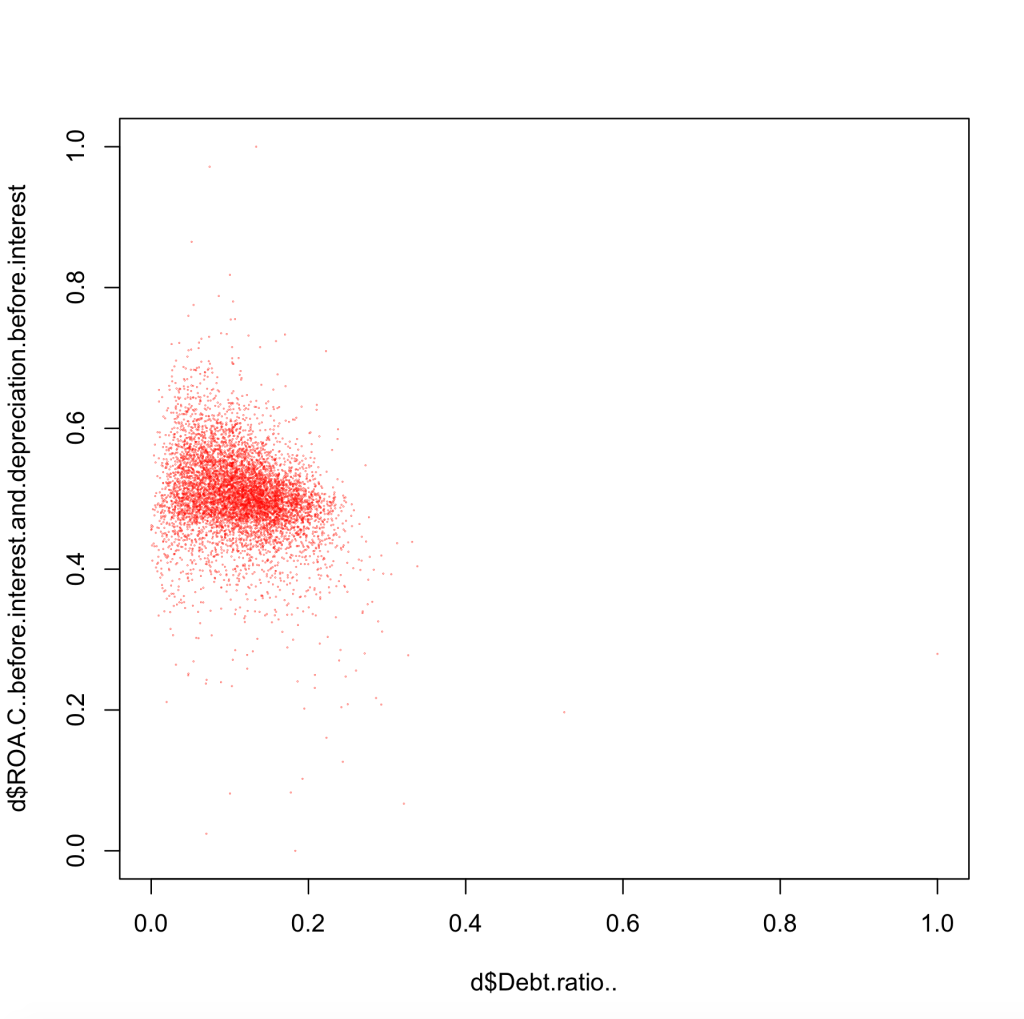
Looking back at the debt figure I used this code to find that the average Debt ratio of a failed company is significantly higher than living businesses.
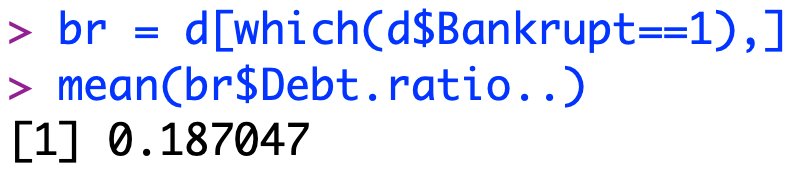

I was able to use the Bankrupt business list to find the mean ROA of bankrupt businesses, which I can now compare to the non bankrupt businesses.

Next time I will attempt to question do companies that go bankrupt have a higher particular ratio than other businesses?

