Plot twist! I changed my data set yet again!
Due to the fact the last dataset was not useable due to corruption of an entire economy, funny how that stuff just “happens”. Now, we are focusing on personal loan rates with data from the lending club. We will try to determine what an interest rate for a person who is applying for a personal loan would be. We will just be looking at loans to pay off credit card debt to try to find commonalities from loan to loan. The variable I will be using to predict this is loan amount.
BUT, for this blog post I will be explaining the relationship of my R-squared value of my new linear function. So, first I will show you my new relationship for this dataset.
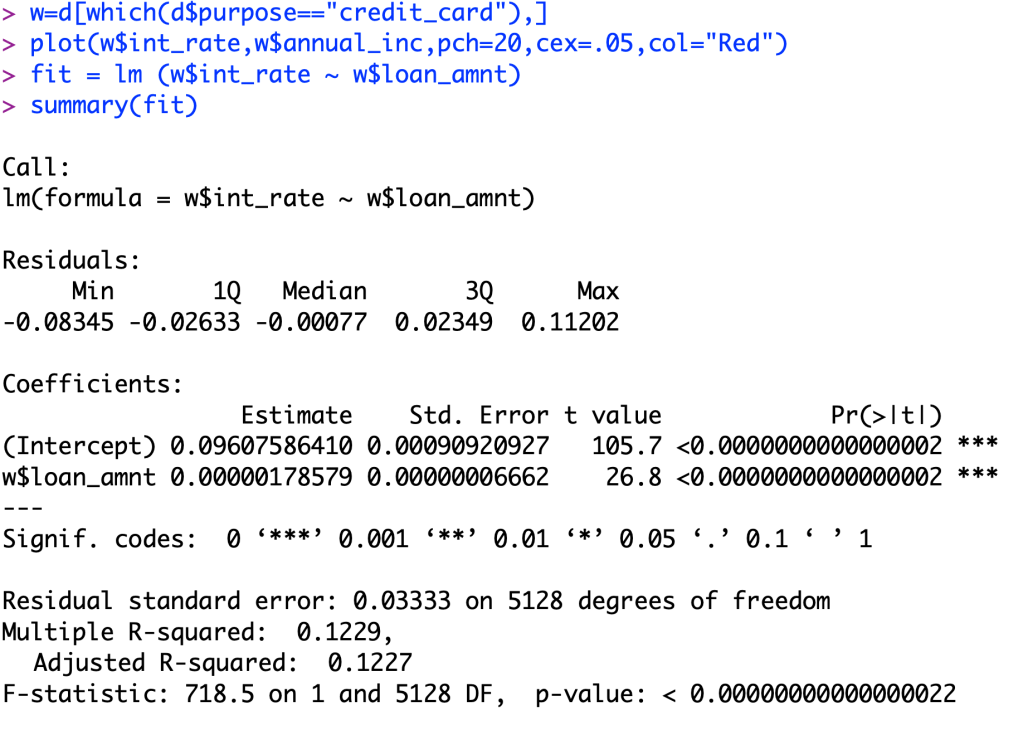
Now, we see that this is a significant relationship because our p-value is close to zero. Now that we got that out of the way we now will look at our R-squared value. Our value for this is 0.1229. What this means is that for all of our data, 12.29% of its variation is able to be explained by this relationship. That means that 87.71% of the data variability in the interest rates are not explained by the loan amount. Now, this a low R-squared value, but out of all of the continuous variables given in the dataset, this is the best model to predict this continuous variable.
