In this post I will be comparing 2 different predictive variables to find out which variable is better at predicting the variable in question. These variable we are trying to predict in this dataset is Net Value Growth Rate. We are using Cash Reinvestment % and Cash Flow per Share to predict this growth rate of the companies. We are comparing the 2 predictive variables to find out which one is better at predicting this growth rate.
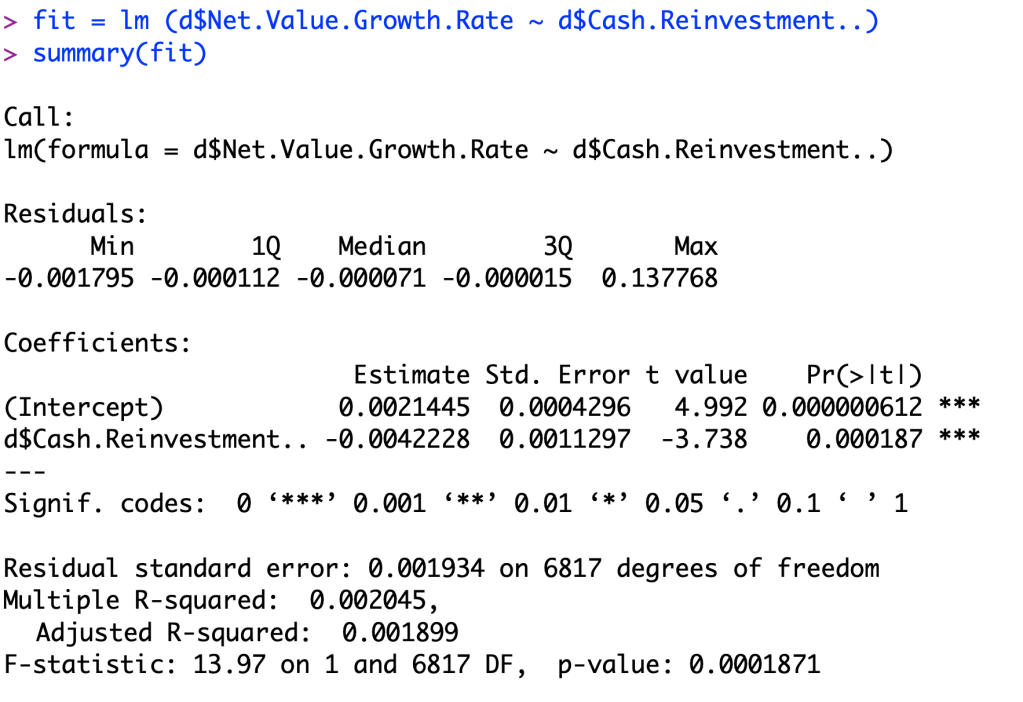
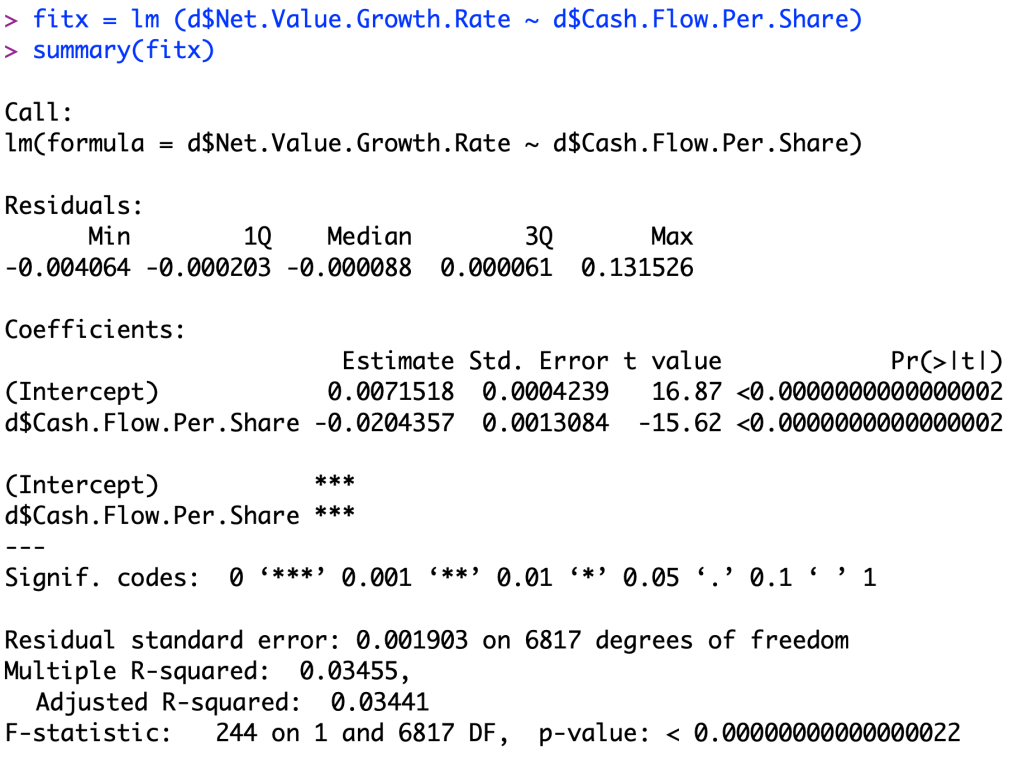
After looking at the data, you can see that the Cash Flow per Share ratio is a better indicator to what a company’s growth rate is going to be. You can tell that the linear regression model in the second picture is going to be a better predictor than the first picture because when you examine the p value for each linear regression model, you notice that the second one has a value near zero. The equation of my new linear regression model is Y=0.0071518+(-0.0204357)X since it fits better than the previous linear regression.
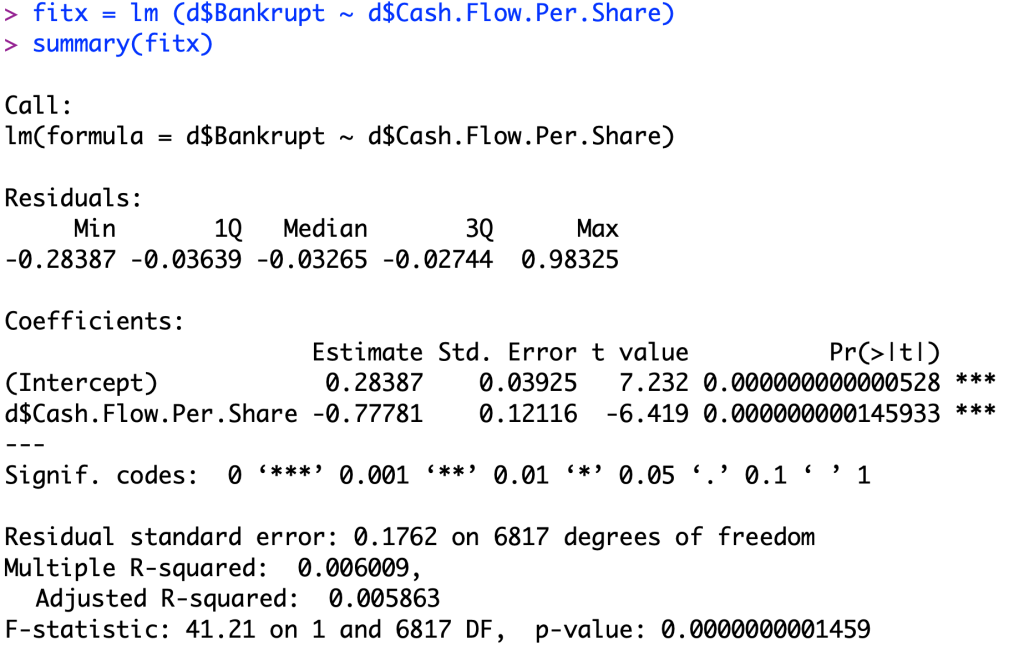
The equation for this linear regression model is Y=0.28387+(-0.77781)X.
To understand this model, we will first look at the intercept. This intercept of 0.28387 and a t-value of 7.232, rejecting the null hypothesis of the intercept being equal to zero, because it is more than 2.95 standard deviations away in the t-distribution. This value means that for businesses that are still alive, they have on average a cash flow per share ratio of 0.28387. And for the coefficient, this value means when the company goes out of business, on average it has an average cash flow per share that is 0.77781 below the average living company (0.28387).
